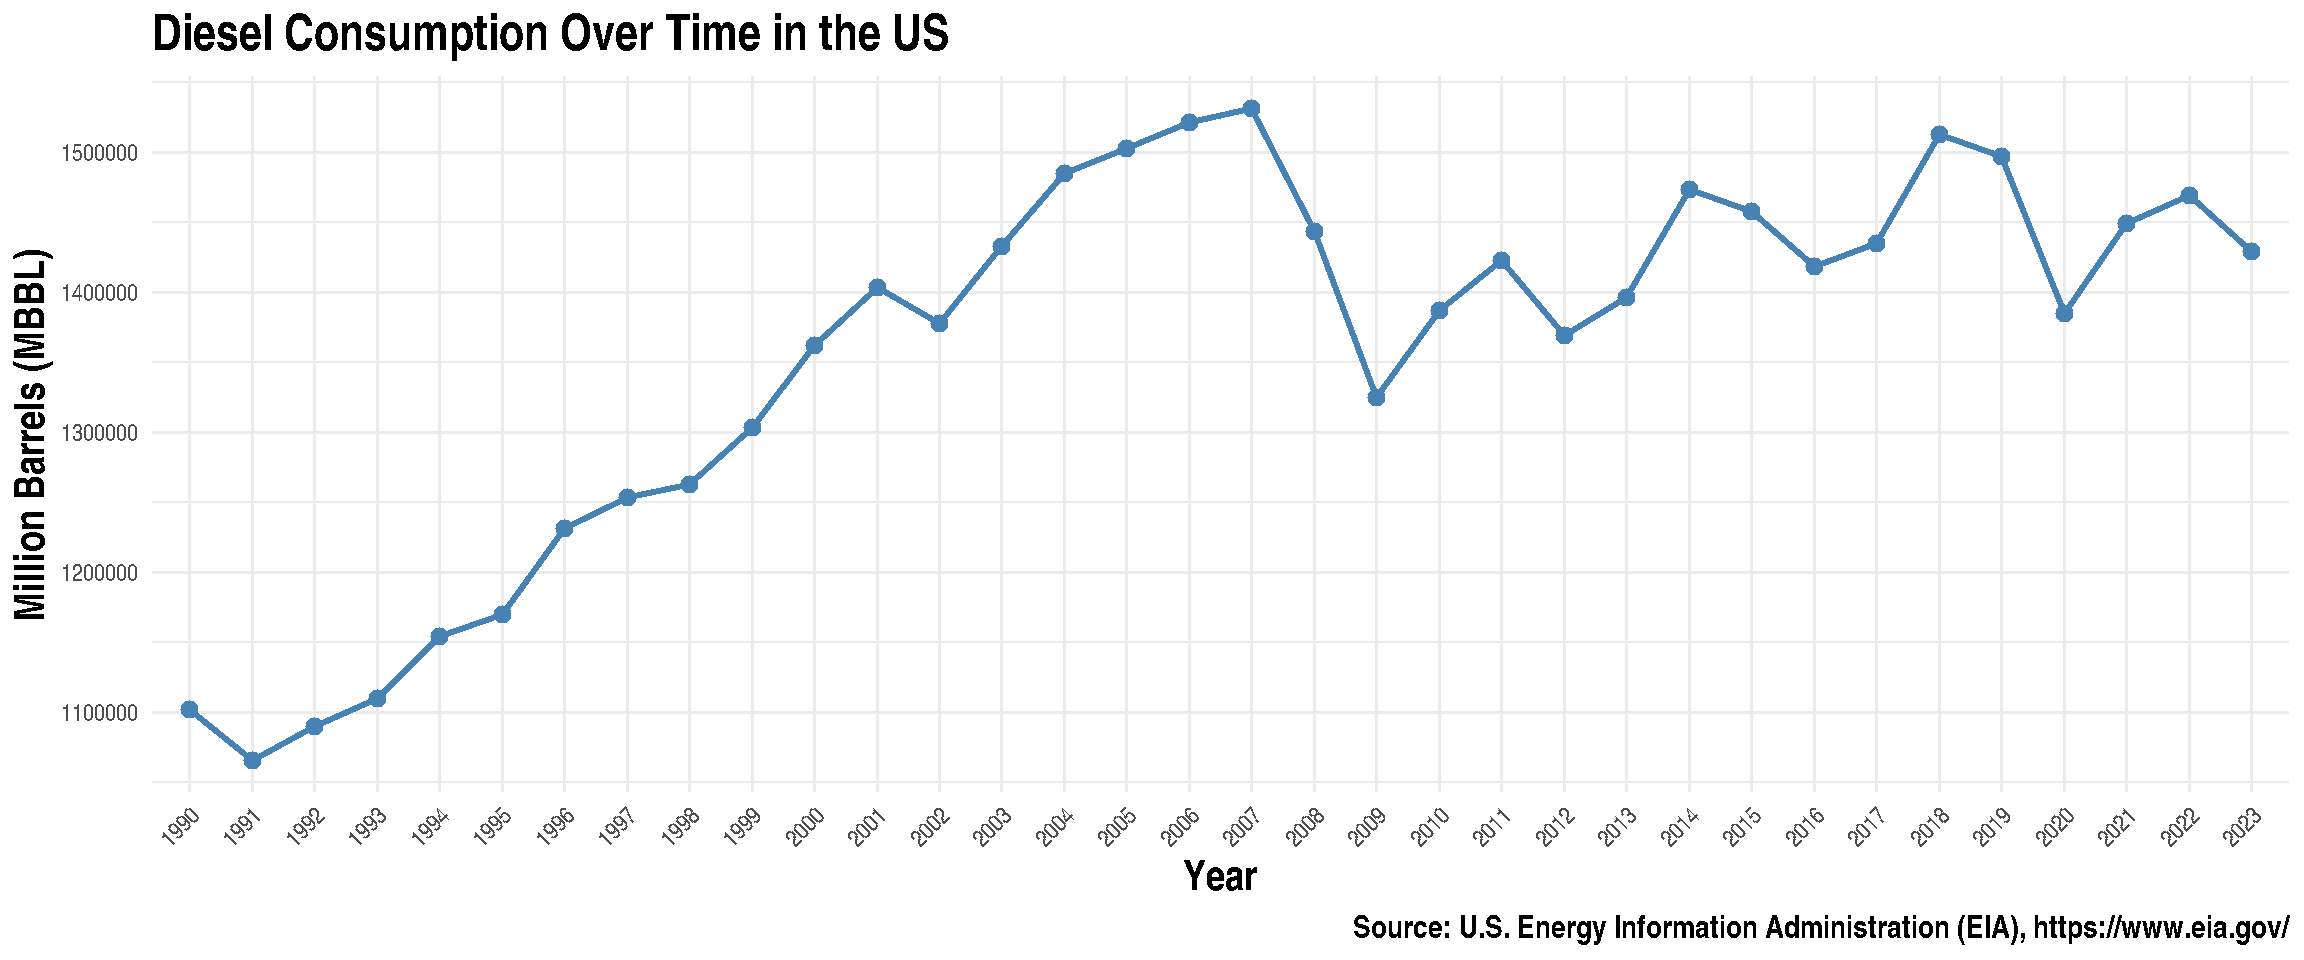
US distillate fuel (diesel) consumption ranges from ≈ 1.07×10⁶ thousand barrels per year in 1990 to 1.43×10⁶ in 2023 with a peak at 1.53×10⁶ in 2007.
Code
# retrieving EIA distillate fuel oil data eia_url <-"https://api.eia.gov/v2/"eia_diesel_cons_query <-request(paste0(eia_url, "petroleum/cons/psup/data")) %>%req_headers(`x-api-key`= api_key) %>%req_url_query(`frequency`="annual",`data[0]`="value",`start`="1990",`end`="2024",#`length` = 10,`facets[product][]`="EPD0"#`facets[region][]` = "US" #`facets[sector][]` = "TR" ) %>%req_perform()diesel_data_result <-resp_body_json(eia_diesel_cons_query)eia_diesel_cons.df <- diesel_data_result$response$data %>%bind_rows() %>%as_tibble()eia_diesel_cons.df$value <-as.numeric(eia_diesel_cons.df$value)eia_diesel_us.df <- eia_diesel_cons.df[eia_diesel_cons.df$`area-name`=="U.S."& eia_diesel_cons.df$units =="MBBL",] ggplot(eia_diesel_us.df, aes(x = period, y = value, group =1)) +geom_line(color ="steelblue", linewidth =1) +geom_point(color ="steelblue", size =2.5) +theme_minimal() +#ylim(0,max(eia_diesel_us.df$value)) +ylab("MBBL") +theme(axis.text.x =element_text(angle =45, hjust =1),title =element_text(size =16, face ="bold"),plot.caption =element_text(size =12)) +labs(title ="Diesel Consumption Over Time in the US",x ="Year",y ="Thousand Barrels (MBBL)",caption ="Source: U.S. Energy Information Administration (EIA), https://www.eia.gov/")
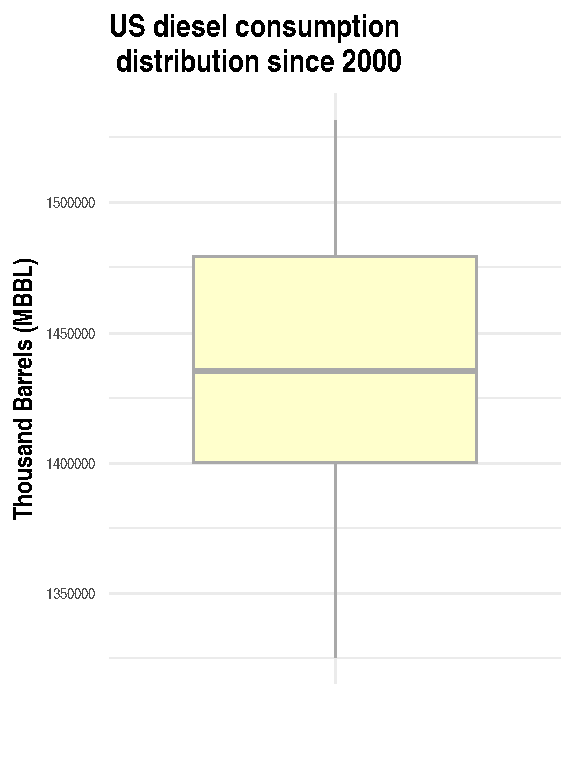
Since 2000, the median consumption is 1.43×10⁶ thousand barrels per year
Code
ggplot(eia_diesel_us.df[eia_diesel_us.df$period >2000,], aes(x="",y = value)) +geom_boxplot(fill ="#FFFFCC", color ="darkgray") +theme_minimal() +theme(title =element_text(size =10, face ="bold"),axis.text.y =element_text(size =6)) +ggtitle("US diesel consumption distribution since 2000") +labs(title ="US diesel consumption\n distribution since 2000",y ="Thousand Barrels (MBBL)",x="")
Code
enframe(summary(eia_diesel_us.df[eia_diesel_us.df$period >2000,]$value), name ="Statistic", value ="MBBL") %>%gt() %>%gt::tab_header(title ="US diesel consumption from 2000 to 2023")